Brand, website, and a visual system for a computational genomics center
Project Overview
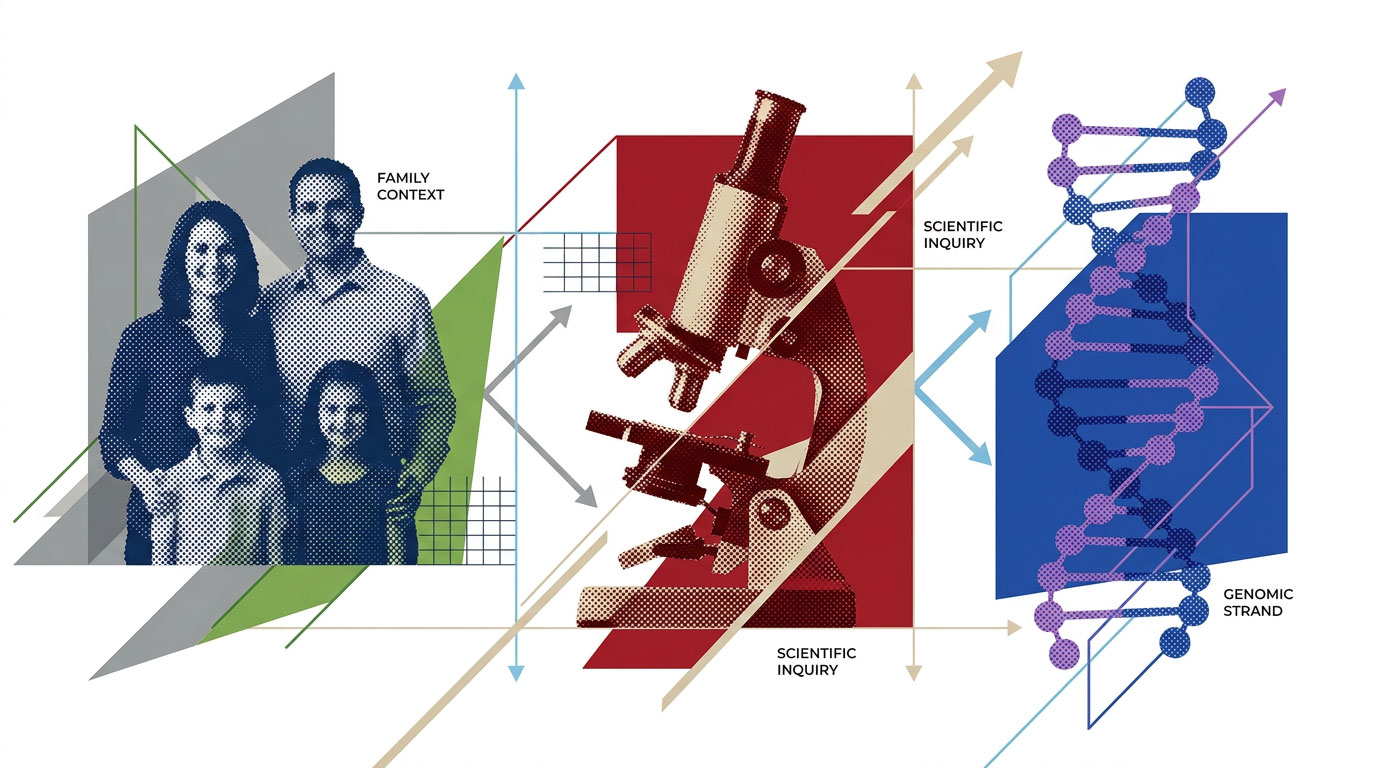
The Utah Center for Genetic Discovery (UCGD) unites computational genomics, software engineering, and translational medicine at the University of Utah. A dense, technical mission needed an identity and a website that make genomic discovery feel human.
Approach
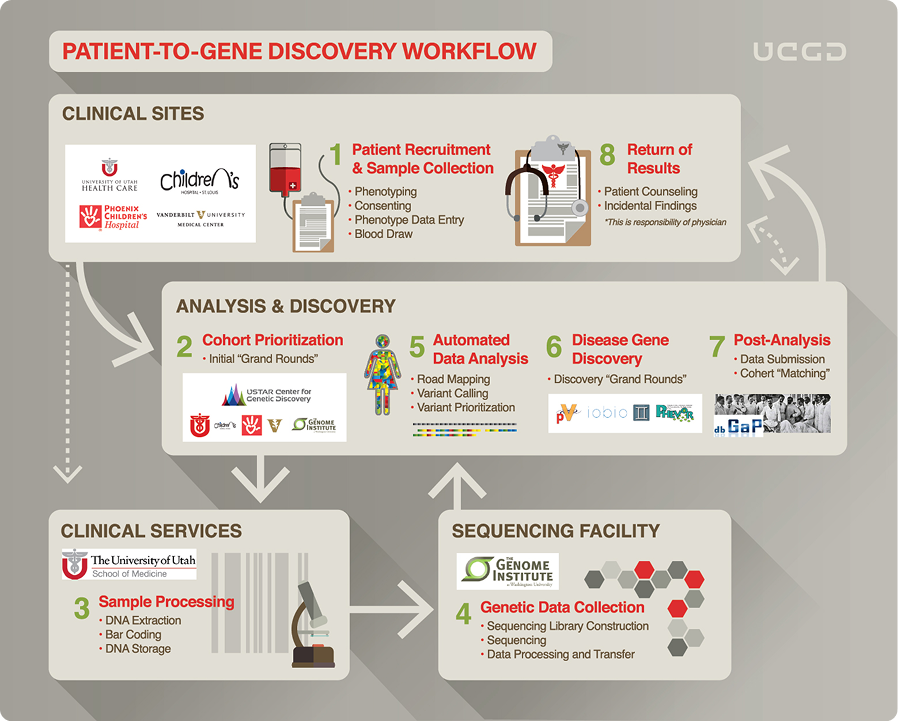
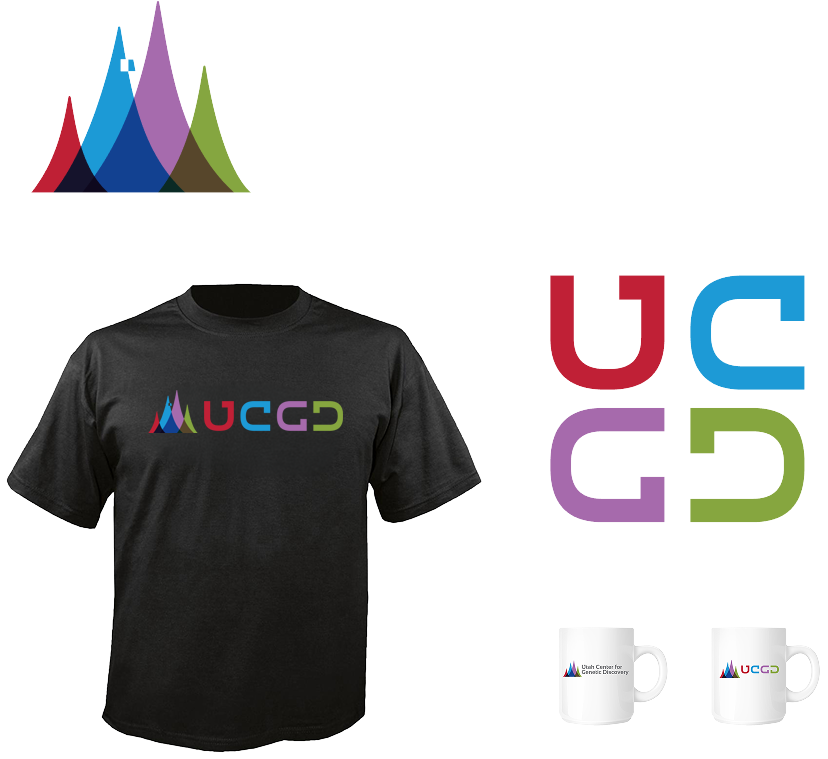
The brand came together and carried across apparel and environment. The website was designed and structured around the center’s two arms. An illustration and icon system tied it together. And the science itself was mapped into clear workflow diagrams, showing how a patient becomes a discovery.
The identity
A mark built from Utah’s peaks and a colorful UCGD monogram.

-
Red #C02036 C0 M83 Y72 K25
-
Blue #1D9AD6 C86 M28 Y0 K16
-
Green #86A63F C19 M0 Y62 K35
-
Violet #A66AAC C3 M38 Y0 K33
-
Beige #E1DED5 C0 M1 Y5 K12
-
Gray #E2E6E6 C2 M0 Y0 K10
Website design, organized around the science
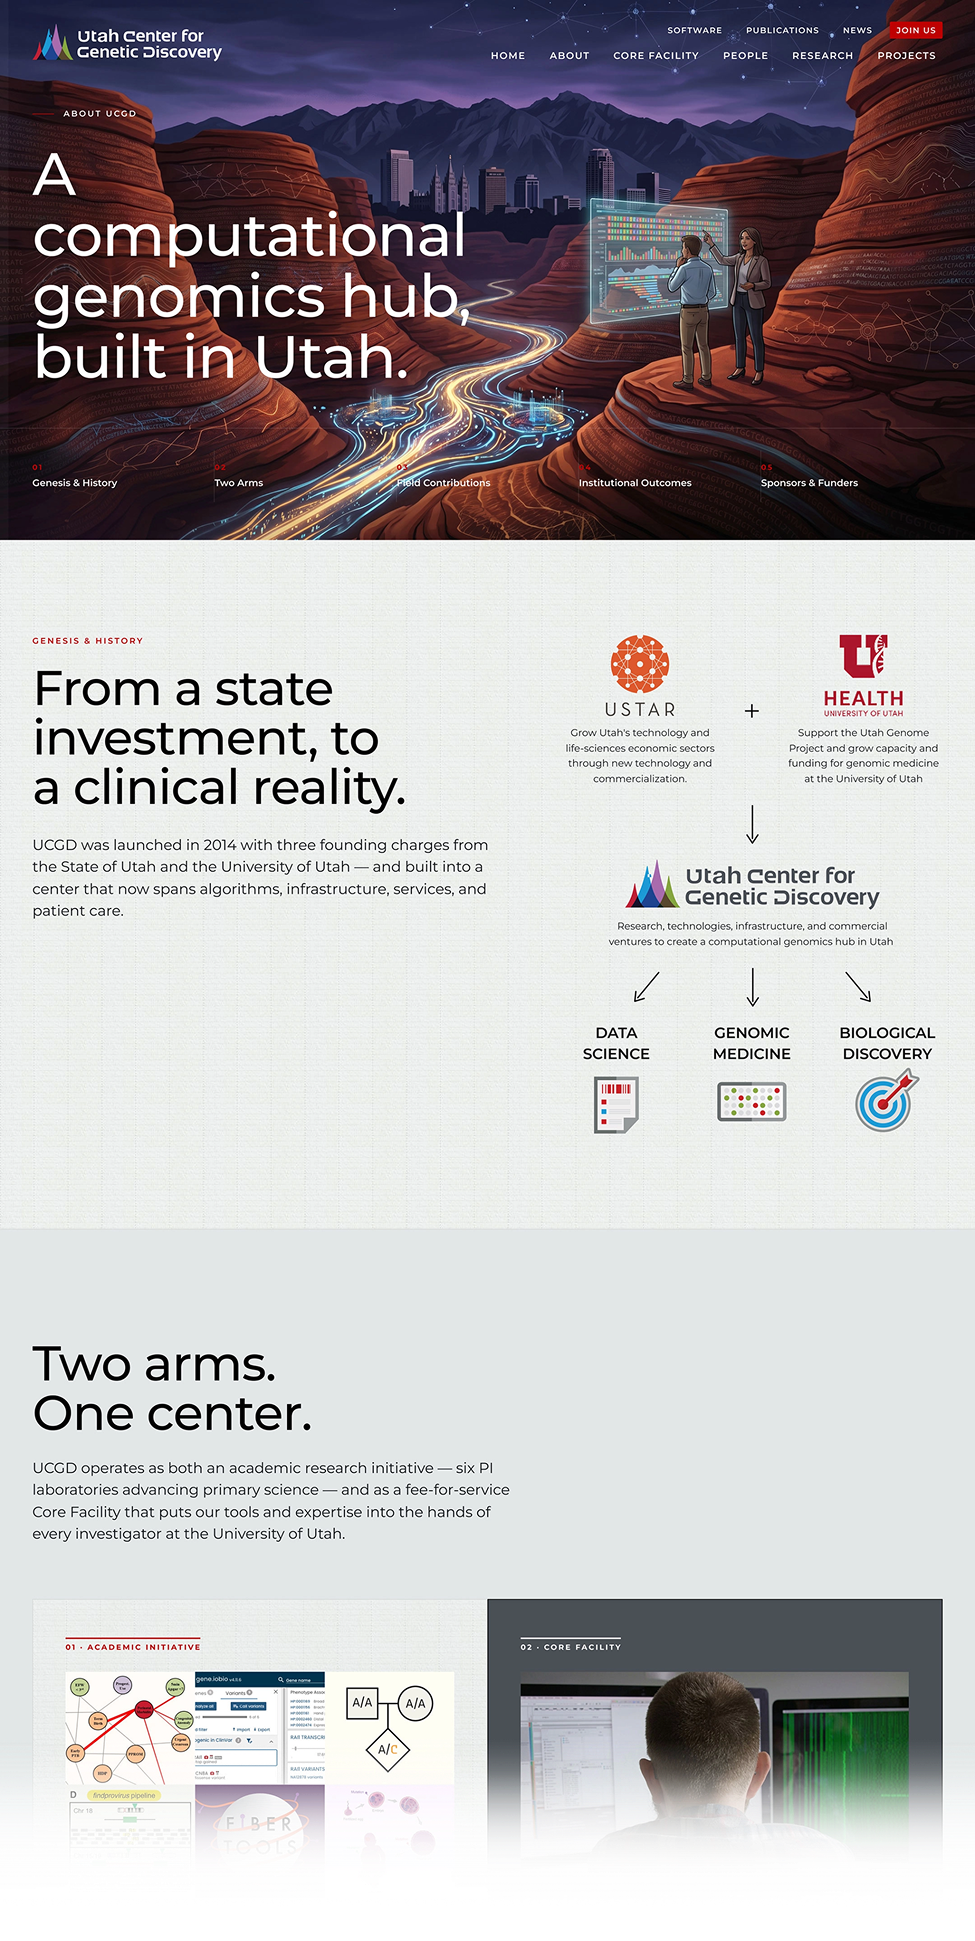
The site is organized around the center’s two arms. One is the academic research initiative, the other the fee-for-service core facility. Together they turn a state investment into a clinical reality.
.png)
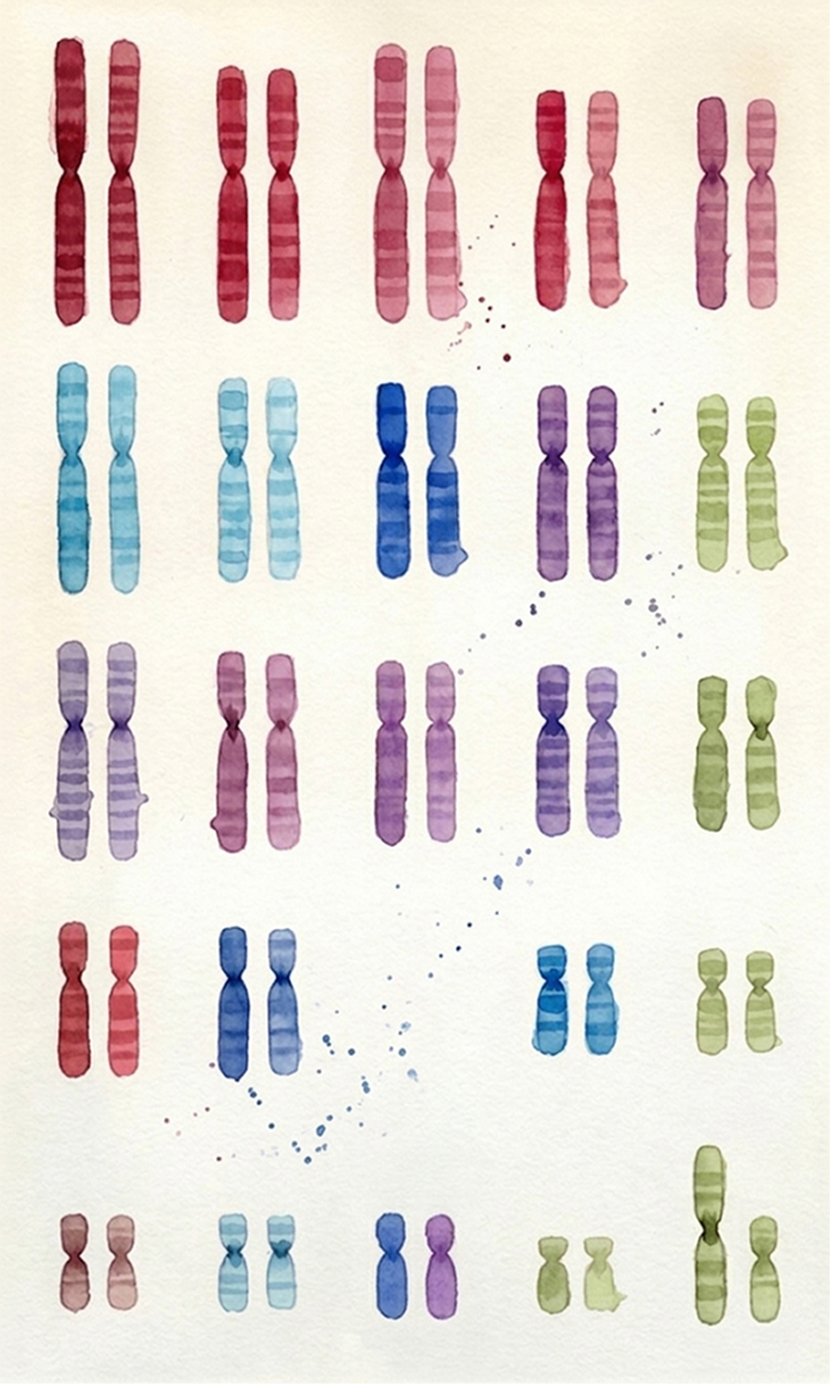
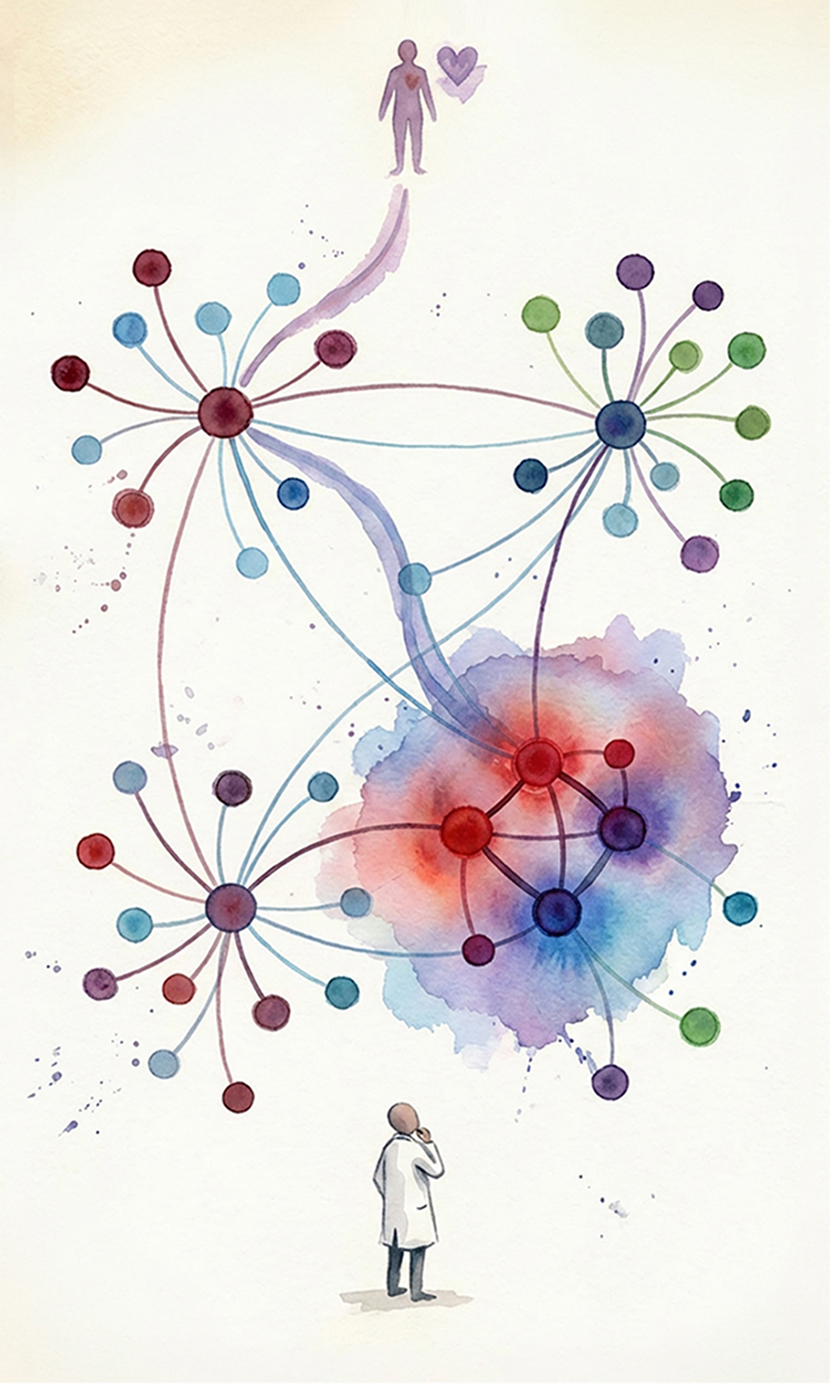
Illustrating a complex field
Watercolor-style illustrations that bring warmth and story to chromosomes, inheritance, and gene networks.

Icon set
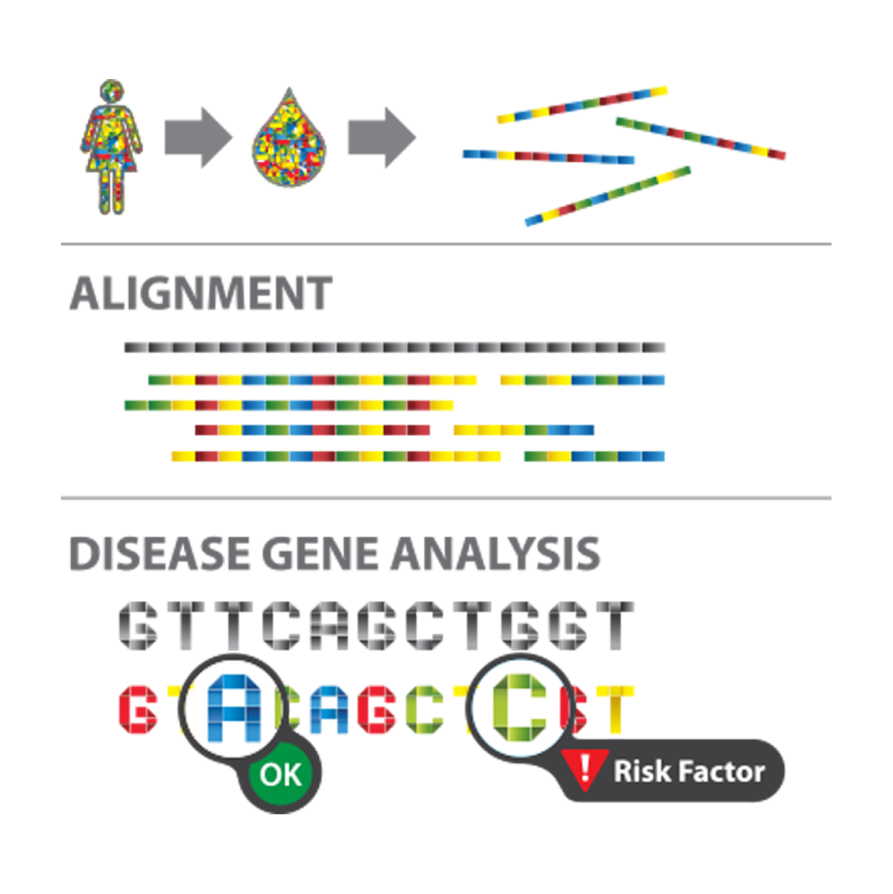
A few of the rounded icons built for the center’s clinical and research touchpoints, plus a simple visual language for sequence alignment and disease-gene analysis.

Making the pipeline legible
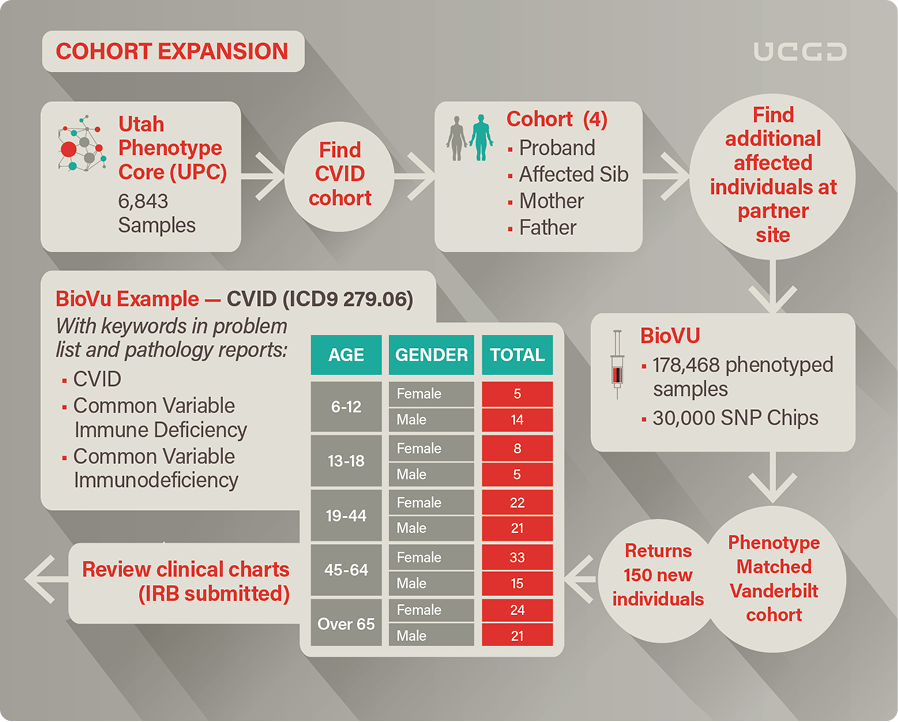
Two diagrams that make a complex research process legible, from expanding a disease cohort to tracing a single patient’s sample all the way to a genetic discovery.